

Survey reminders are not optional follow-ups. They are the difference between a 12% response rate and a 35% response rate. A single email caps at 12-15% completion. A well-designed 4-touch sequence pushes B2B response rates above 30%.
This guide gives you the complete framework: when to send each reminder, what subject lines actually get opened, how to handle mobile respondents, what compliance requirements apply in 2026, and what to do after responses arrive.
Why Survey Response Rates Matter More Than You Think
Response rates directly impact business decisions. A 15% response rate from 1,000 customers yields 150 data points. A 35% response rate yields 350 data points. The difference changes product roadmaps, pricing decisions, and retention strategies.
Low response rates also introduce bias. The customers who respond without reminders are often your most engaged users. Detractors and at-risk accounts rarely volunteer feedback. Reminder sequences surface the silent majority who would otherwise stay invisible.
The cost of low response rates compounds. You spend time and budget building surveys. Poor response rates mean that investment produces unreliable data. Reminder sequences protect that investment by ensuring representative samples.

Survey Types and Their Unique Reminder Strategies
Different survey types require different reminder approaches. NPS surveys measure loyalty and need relationship-focused messaging. CSAT surveys measure transaction satisfaction and should reference the specific interaction. Product feedback surveys need context about the feature being evaluated.
NPS Survey Reminder Strategy
NPS surveys ask “How likely are you to recommend us?” The reminder sequence should reinforce the relationship, not the transaction. Send the first reminder on day 3 with messaging that emphasizes “your feedback shapes our direction.” The second reminder on day 7 should reference specific ways past customer input influenced product decisions. The final reminder on day 14 positions the survey as a relationship checkpoint, not a transaction requirement.
NPS response rates average 25-30% with proper reminder sequences. Response rates drop below 20% when reminders feel transactional rather than relational.
CSAT Survey Reminder Strategy
CSAT surveys follow specific touchpoints like support tickets or purchases. The reminder sequence must reference that touchpoint to maintain relevance. Send the first reminder on day 2 because CSAT context decays quickly. The second reminder on day 5 should include a one-click option for busy respondents. The final reminder on day 10 acknowledges the interaction may no longer be top-of-mind but still valuable.
CSAT response rates average 30-40% when sent within 48 hours of the interaction. Rates drop to 15-20% when sent more than a week later without strong reminders.
Product Feedback Survey Reminder Strategy
Product feedback surveys target specific feature usage. The reminder sequence should demonstrate that you understand their usage pattern. Send the first reminder on day 4 with messaging that references their specific activity. The second reminder on day 8 should show how similar users benefited from providing feedback. The final reminder on day 14 positions their input as shaping the feature they already use.
Product feedback response rates average 20-25% because the ask feels more specific and therefore more effortful. Strong personalization in reminders can push rates to 30%.
Employee Engagement Survey Reminder Strategy
Employee surveys face different constraints than customer surveys. Employees cannot unsubscribe, but they can provide low-quality responses. The reminder sequence must balance persistence with respect for their time. Send the first reminder on day 5 with messaging that emphasizes leadership visibility. The second reminder on day 10 should include progress statistics showing how many colleagues have responded. The final reminder on day 14 positions completion as a team contribution rather than an individual obligation.
Employee survey response rates average 40-60% with proper internal communication and reminder sequences. Rates below 40% signal trust or relevance issues that reminders alone cannot fix.
Survey Design Fundamentals That Affect Response Rates
Email deliverability gets attention, but survey design determines whether opened emails convert to completed responses. A 3-minute survey with clear questions outperforms a 10-minute survey regardless of how many reminders you send.
Optimal Survey Length
Surveys with 5-7 questions achieve the best completion rates. Response rates drop 15-20% when surveys exceed 10 questions. Mobile respondents abandon at even shorter lengths because typing on phones is slower.
The 3-minute rule applies universally. Tell respondents upfront how long the survey takes. If your survey takes longer than 5 minutes, break it into multiple shorter surveys sent at different times.
Question types affect perceived length. Multiple-choice questions feel faster than open-ended questions. Sliders and rating scales feel faster than text fields. A 10-question survey with all multiple choice may feel shorter than a 5-question survey with 3 open-ended responses.
Mobile Optimization Requirements
Over 60% of survey responses now come from mobile devices. Survey platforms that render poorly on mobile lose respondents before they reach question 2. Test your survey on both iOS and Android before sending.
Mobile-optimized surveys use larger tap targets, readable font sizes without zooming, and single-column layouts. Questions should fit on one screen without scrolling. Progress indicators must be visible on mobile viewports.
Email templates must also render on mobile. Subject lines longer than 40 characters get truncated. Preview text should reinforce the subject line, not repeat it. Call-to-action buttons need minimum 44×44 pixel tap targets.
Progress Indicators and Completion Expectations
Progress bars increase completion rates by 10-15% for surveys longer than 5 questions. Respondents need to know they are making progress. Without a progress indicator, a 10-question survey feels endless regardless of actual length.
Set accurate time expectations in the email. “Takes 3 minutes” must match reality. If your survey takes 4 minutes, say 5 minutes. Under-promising and over-delivering on time builds trust. Over-promising and under-delivering creates frustration.
Question Order and Logic
Start with the easiest question. The first question should require minimal thought and have obvious answer options. This reduces early abandonment. Save open-ended questions for the middle or end when respondents are already invested.
Use logic branching to skip irrelevant questions. Asking B2B respondents about consumer products wastes their time and signals that you did not segment properly. Branching reduces perceived length and increases data quality.
The Complete Survey Reminder Email Sequence Framework
A single email is not a strategy. A 4-touch sequence with decreasing frequency and increasing urgency converts the maximum number of respondents without creating fatigue.
Day 0: Initial Survey Send
The initial send should feel like an opportunity, not an obligation. Subject lines should create curiosity without clickbait. Body copy should explain the value of their feedback before asking for it. The call-to-action should be prominent but not aggressive.
Send the initial survey on Tuesday, Wednesday, or Thursday between 9-11 AM in the recipient’s local time. Monday mornings and Friday afternoons have lower open rates. Avoid sending on weekends unless your audience specifically engages on weekends.
Day 2-3: First Reminder (Gentle Nudge)
The first reminder acknowledges that the initial email may have been missed. It does not assume the recipient ignored the request. The tone should be helpful rather than corrective.
Subject Line Options:
- Quick follow-up on your feedback
- Your thoughts on [specific topic]?
- Following up: [survey topic] input needed
- 3 minutes to shape [specific outcome]
Email Body Structure:
1. Reference the initial send without assuming they saw it
2. Restate the value of their specific perspective
3. Provide the survey link prominently
4. Mention the estimated time commitment
5. Close with appreciation, not pressure
Day 5-7: Second Reminder (Value-Driven)
The second reminder shifts from “we sent this” to “your input matters.” It should demonstrate that responses are being reviewed and acted upon. Include a specific example of how past feedback influenced decisions.
Subject Line Options:
- Your input shapes our [specific initiative]
- Last chance to influence [roadmap item]
- [Company] customers helped build [feature]
- One more chance to share your perspective
Email Body Structure:
1. Reference the number of responses received so far (social proof)
2. Share a concrete example of past feedback implementation
3. Explain what decisions their input will influence
4. Provide the survey link with estimated time
5. Acknowledge their other priorities while emphasizing the deadline
Day 10-14: Final Reminder (Last Chance)
The final reminder creates gentle urgency without manipulation. It should position non-response as a choice, not a failure. The tone should remain appreciative even if they choose not to participate.
Subject Line Options:
- Closing [survey name] in 48 hours
- Final opportunity: [survey topic] feedback
- [Survey name] closes tomorrow
- Your last chance to share input on [topic]
Email Body Structure:
1. State the exact closing date and time
2. Provide the survey link one final time
3. Offer an opt-out that feels respectful, not manipulative
4. Thank them regardless of participation
5. Close the relationship positively for future surveys
Send Time Windows by Audience
B2B audiences respond best Tuesday-Thursday, 9-11 AM local time. B2C audiences show more variation by product category. E-commerce customers respond well on weekends. SaaS users respond during weekday business hours. Test send times for your specific audience rather than following generic B2B or B2C rules.
Avoid sending reminders on the same day as major holidays or industry events. A survey reminder during Black Friday or CES will be ignored regardless of how well-crafted the copy is.
Subject Lines That Get Opened: Data-Backed Patterns
Subject lines determine whether your reminder is seen. The word “survey” in subject lines reduces open rates by 10%. The word “reminder” triggers spam filters. Personalization increases open rates by 26-50% depending on the research cited.
Proven Subject Line Patterns
Curiosity-Driven Patterns:
- Quick question about {{companyName}}
- {{firstName}}, thoughts on [specific topic]?
- Following up on your [recent activity]
- Question regarding {{companyName}}’s [process/initiative]
Personalization Patterns:
- {{firstName}} – quick feedback request
- Your input on [specific feature], {{firstName}}
- [Company] values your perspective, {{firstName}}
Specificity Patterns:
- 3 minutes to improve [specific outcome]
- Help shape [roadmap item] for Q3
- Your [specific interaction] feedback needed
Urgency Patterns (Use Carefully):
- Closing [survey name] tomorrow
- Final 48 hours for [survey topic] input
- Last opportunity: [survey name] feedback
Words and Patterns to Avoid
Remove these words from subject lines entirely:
- Survey
- Reminder
- Urgent
- Act now
- Limited time
- Free
- Winner
- Bonus
- Exclusive
- Important
Avoid excessive punctuation (!!!), ALL CAPS, and emoji. These patterns trigger spam filters and reduce deliverability for the entire domain.
Subject Line Length Guidelines
Subject lines under 40 characters display fully on mobile devices. Subject lines 40-50 characters display partially on mobile. Subject lines over 50 characters get truncated on both mobile and desktop. The most important information should appear in the first 40 characters.
A/B Testing Subject Lines
Test one variable at a time. Test subject line A against subject line B for 100 sends each. Measure open rates, not just clicks. A subject line that gets opened but not clicked may indicate a mismatch between the promise and the survey content.
Run tests for at least 3-5 days to account for day-of-week variation. A subject line tested only on Tuesday may not perform the same on Friday. Document winning subject lines for future campaigns rather than starting from scratch each time.
Email Deliverability for Survey Campaigns
Survey emails face unique deliverability challenges. They are not transactional, so they cannot use dedicated transactional domains. They are not sales emails, so they should not trigger promotional folder placement. The middle ground requires careful authentication and reputation management.
SPF, DKIM, and DMARC Requirements
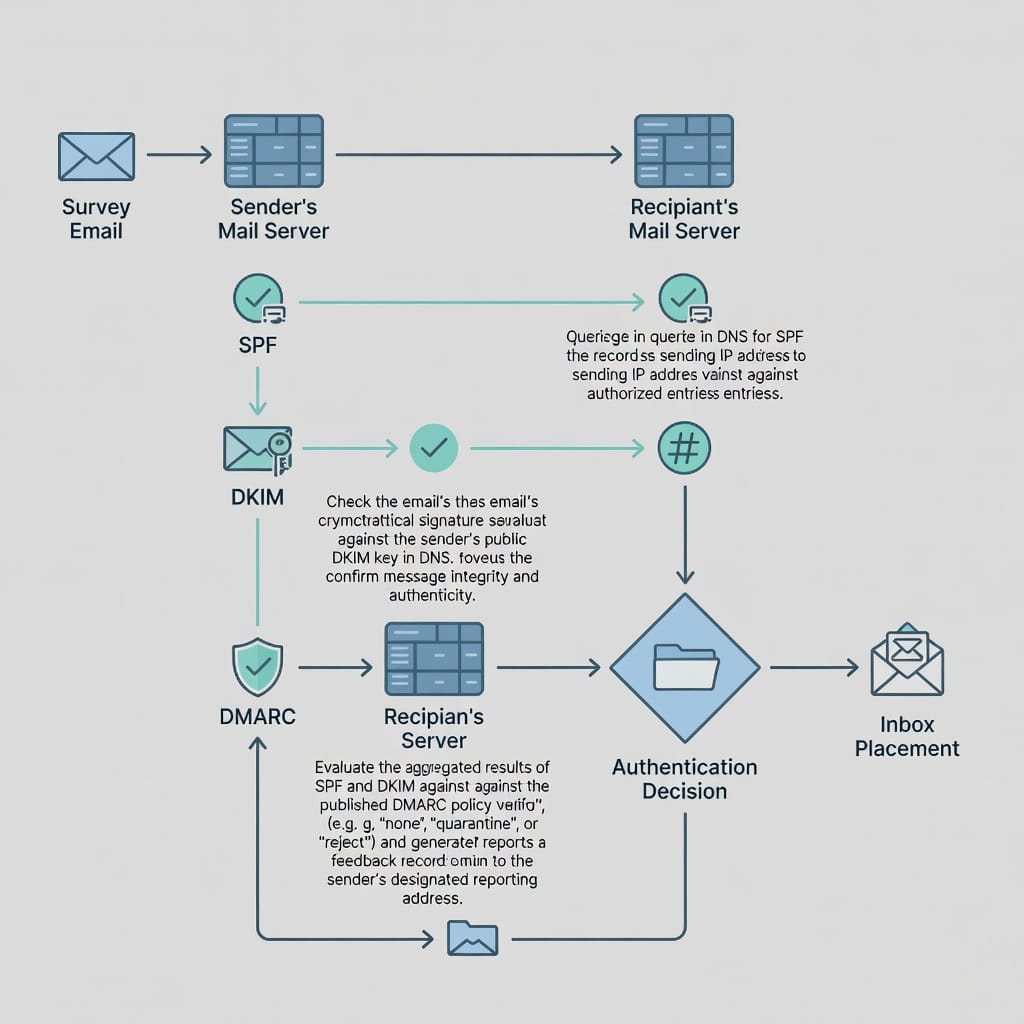
SPF (Sender Policy Framework) authorizes specific servers to send email on behalf of your domain. Add your email service provider’s servers to your SPF record. Survey platforms that send through their own domains may require additional SPF configuration.
DKIM (DomainKeys Identified Mail) adds a cryptographic signature that verifies the email was not modified in transit. Enable DKIM signing for your domain and add the public key to your DNS records. Most email service providers provide DKIM setup instructions.
DMARC (Domain-based Message Authentication, Reporting, and Conformance) tells receiving servers what to do when SPF or DKIM checks fail. Start with a monitoring-only DMARC record (p=none) to gather data before enforcing stricter policies. Monitor DMARC reports for authentication failures that indicate spoofing or configuration issues.
For more detail on email authentication setup, see our guide to email deliverability.
Domain Reputation and Warmup
New domains have no reputation. Email service providers treat unknown domains with suspicion. Warmup your email accounts gradually by sending low volumes of legitimate email before launching survey campaigns.
A domain sending 10,000 survey emails on day one will likely land in spam. A domain sending 50 emails per day for 30 days before scaling builds the reputation needed for survey campaigns. The warmup period varies by provider and sending history.
Inbox Placement Testing
Test inbox placement before sending survey campaigns to your full list. Send test emails to seed accounts at Gmail, Outlook, Yahoo, and corporate domains. Check whether test emails land in primary inbox, promotions, spam, or get blocked entirely.
Tools like GlockApps, Mail-Tester, and MXToolbox provide inbox placement testing. Run placement tests after any significant change to your email infrastructure or sending patterns.
Common Deliverability Issues for Survey Emails
Survey emails often include links to third-party survey platforms. Excessive links or links to low-reputation domains can trigger spam filters. Use branded short links or your own domain redirects when possible.
Survey emails may reference specific customer interactions or account details. Ensure that personalization tokens render correctly and do not display as raw variables like {{firstName}}. Broken personalization signals poor list hygiene and reduces deliverability.
Mobile Optimization: Where 60% of Your Responses Happen
Mobile email rendering differs significantly from desktop. A survey invitation that looks professional on desktop may render as unreadable on mobile. Test every email template on both platforms before sending.
Email Template Mobile Requirements
Subject lines under 40 characters display fully on mobile. Preview text should complement the subject line, not repeat it. The first visible line of the email body should contain the primary call-to-action or value proposition.
Font sizes should be at least 14px for body text and 16px for headings. Smaller fonts require zooming, which creates friction. Line spacing should be 1.4 or higher for readability on small screens.
Call-to-action buttons need minimum 44×44 pixel tap targets. Smaller buttons create missed taps and frustration. Use high-contrast colors for buttons with sufficient padding from surrounding text.
Survey Platform Mobile Optimization
Choose survey platforms that render natively on mobile devices. Typeform, SurveyMonkey, and Google Forms all offer mobile-optimized experiences. Avoid platforms that require Flash, Java, or other deprecated technologies.
Test your survey on both iOS Safari and Android Chrome. Check that questions fit on one screen without horizontal scrolling. Verify that dropdown menus and multi-select options work with touch input.
SMS and Push Notification Alternatives
Some audiences respond better to SMS or push notifications than email. SMS open rates average 98% within 3 minutes. Push notification open rates average 50-70% depending on the app category.
Consider a multi-channel approach for high-value surveys. Send the initial invitation via email with SMS as the first reminder. Use push notifications for the final reminder if the recipient has your app installed. Multi-channel sequences can increase response rates by 15-25% compared to email-only sequences.
Incentives That Boost Response Rates Without Breaking Trust
Incentives increase response rates, but they also introduce bias. Respondents motivated by rewards may provide different answers than respondents motivated by the desire to provide feedback. Consider whether the incentive aligns with your research goals before implementing.
Incentive Types and Effectiveness
Gift Cards and Cash: $5-10 gift cards increase response rates by 10-20%. Higher amounts show diminishing returns. Amazon gift cards have the broadest appeal. Industry-specific gift cards (Starbucks, Target) may appeal more to certain demographics.
Charitable Donations: Offering to donate $5 to a charity of the respondent’s choice appeals to altruistic motivations. Response rate increases average 8-15%. This incentive works well for B2B audiences who may not want personal compensation.
Early Access and Exclusive Content: Offering early access to new features or exclusive content works for product feedback surveys. Response rate increases average 5-12%. This incentive aligns respondent motivation with product usage.
Sweepstakes and Contests: A chance to win a larger prize ($100-500) costs less per respondent than guaranteed smaller incentives. Response rate increases average 8-18%. However, sweepstakes attract a different respondent type than guaranteed incentives.
When Not to Use Incentives
Incentives can bias responses toward positive feedback. Respondents who receive compensation may feel obligated to provide favorable answers. For NPS surveys measuring genuine loyalty, incentives may inflate scores artificially.
Incentives also create expectation for future surveys. Once you offer compensation, respondents may expect it for all future requests. Consider whether you can sustain incentive programs long-term before starting.
Incentive Delivery and Compliance
Deliver incentives promptly after survey completion. Delayed incentives reduce the perceived value and may decrease future response rates. Automate delivery where possible using survey platform integrations.
Document incentive programs for compliance purposes. Some jurisdictions treat incentives as taxable income. Provide recipients with necessary tax documentation if required. Consult legal counsel for cross-border survey programs with monetary incentives.
Timing Surveys to the Customer Journey
Generic timing rules ignore the customer context that makes surveys relevant. A survey sent immediately after a support interaction has different requirements than a survey sent six months after purchase. Match survey timing to the touchpoint, not the calendar.
Post-Purchase Survey Timing
Send post-purchase surveys 3-7 days after delivery. This window allows time for product use while the purchase remains memorable. Earlier surveys capture expectations rather than experience. Later surveys suffer from memory decay.
E-commerce post-purchase surveys should reference the specific order. “How was your recent purchase?” outperforms “How do you feel about our products?” by grounding the question in a specific experience.
Post-Support Survey Timing
Send post-support surveys within 24-48 hours of ticket resolution. Support interactions have short memory windows. A customer who received help on Monday may not remember details by Friday. Immediate surveys capture accurate satisfaction data.
Support surveys should reference the ticket number or issue type. “How did we handle your recent support request?” outperforms “How satisfied are you with our support?” by maintaining specificity.
Post-Onboarding Survey Timing
Send post-onboarding surveys 14-30 days after account creation. This window allows time for initial setup and first value realization. Earlier surveys capture setup friction rather than product value. Later surveys miss the critical onboarding experience.
Onboarding surveys should ask about specific setup steps. “How easy was it to connect your data sources?” outperforms “How was your onboarding experience?” by focusing on measurable interactions.
Churn Risk Survey Timing
Send churn risk surveys when behavioral signals indicate disengagement. Trigger surveys based on usage drops, failed payments, or support ticket sentiment. Timing should respond to customer behavior, not calendar dates.
Churn surveys require careful messaging. The goal is understanding, not retention. “Help us understand your experience” outperforms “We noticed you have not logged in recently” by focusing on their perspective rather than your metrics.
Milestone Survey Timing
Send milestone surveys at account anniversaries, usage milestones, or renewal periods. These surveys capture relationship health at predictable intervals. Annual NPS surveys sent on account creation anniversaries provide year-over-year comparison data.
Milestone surveys should acknowledge the relationship duration. “As a 2-year customer, your perspective matters” outperforms “Please take our survey” by recognizing their tenure and implied expertise.
Recovering Partial Completions and Abandoned Surveys
Not all survey starts result in completions. Partial completion rates average 20-40% depending on survey length and complexity. Recovery emails can convert 10-15% of partial completions into full responses.
Identifying Partial Completion Patterns
Most partial completions happen at predictable points. Long open-ended questions cause drop-off. Confusing question wording causes drop-off. Technical issues with specific question types cause drop-off. Analyze your survey analytics to identify the questions where respondents abandon.
Recovery emails should reference the specific point of abandonment. “You were almost done with our feedback survey” outperforms “You started our survey but did not finish” by acknowledging their progress.
Recovery Email Timing and Content
Send recovery emails 24-48 hours after partial completion. The respondent’s context remains fresh, but they have had time to step away from the survey. Later recovery emails have lower conversion rates.
Recovery emails should offer a simplified path forward. Provide a direct link to the survey that resumes at the abandonment point if your platform supports it. Otherwise, provide the original survey link with an acknowledgment that they may need to start over.
When to Stop Recovery Attempts
Do not send more than 2 recovery emails for a single partial completion. Additional attempts create annoyance without meaningful conversion improvement. Mark persistent partial completers as “survey fatigued” and exclude them from future surveys for 90 days.
Compliance and Legal Requirements for Survey Emails
Survey emails must comply with email marketing regulations regardless of their research purpose. CAN-SPAM, GDPR, and CASL each impose requirements that affect survey program design.
CAN-SPAM Requirements (United States)
CAN-SPAM requires that commercial emails include accurate sender identification, a valid physical postal address, and a functioning unsubscribe mechanism. Survey emails sent to customers or prospects qualify as commercial email under CAN-SPAM.
Include your physical address in the email footer. Provide an unsubscribe link that removes the recipient from all future survey emails, not just the current campaign. Process unsubscribe requests within 10 business days as required by law.
GDPR Requirements (European Union)
GDPR requires a lawful basis for processing personal data. For survey emails, the lawful basis is typically “legitimate interest” for existing customers or “consent” for prospects. Document your lawful basis before sending.
GDPR also requires data minimization. Collect only the personal data necessary for your research purpose. Do not ask for birth dates, income ranges, or other sensitive information unless directly relevant to your survey objectives.
Provide a privacy policy link in survey emails. The policy should explain what data you collect, how you use it, how long you retain it, and how respondents can request deletion. Survey responses are personal data under GDPR and subject to access and deletion requests.
CASL Requirements (Canada)
CASL requires express or implied consent before sending commercial electronic messages. Existing customers have implied consent for 24 months after their last transaction. Prospects require express consent obtained through a documented opt-in process.
CASL also requires an unsubscribe mechanism and accurate sender identification. Unlike CAN-SPAM, CASL requires the unsubscribe mechanism to be prominently displayed, not just present in the footer.
Industry-Specific Compliance
Healthcare surveys may require HIPAA compliance if they involve protected health information. Financial services surveys may require additional disclosures under GLBA. Research surveys involving human subjects may require IRB approval.
Consult legal counsel for your industry before launching survey programs. Compliance requirements vary by jurisdiction and use case. The cost of non-compliance exceeds the cost of proper legal review.
Industry-Specific Response Rate Benchmarks
Response rates vary significantly by industry. A 25% response rate that would be excellent for e-commerce may be below average for B2B SaaS. Use industry benchmarks to set realistic expectations and identify improvement opportunities.
SaaS and Technology
SaaS companies achieve average response rates of 30-40% for NPS surveys with proper reminder sequences. Product feedback surveys average 20-30%. Employee engagement surveys average 50-70% with strong internal communication.
SaaS response rates benefit from existing customer relationships and product usage context. Customers who actively use your product have more context for feedback and higher motivation to respond.
B2B Services
B2B services companies achieve average response rates of 20-30% for customer satisfaction surveys. Response rates vary by relationship depth. Strategic accounts with dedicated account managers respond at 35-45%. Transactional accounts respond at 15-25%.
B2B response rates improve when surveys reference specific account activity. Generic “how are we doing?” surveys underperform compared to “how did our Q2 implementation go?” surveys that demonstrate account knowledge.
E-commerce and Retail
E-commerce companies achieve average response rates of 15-25% for post-purchase surveys. Response rates vary by product category. High-consideration purchases like furniture or electronics generate higher response rates than low-consideration purchases like consumables.
E-commerce response rates improve with order-specific context. “How was your recent purchase of [product]?” outperforms “How was your shopping experience?” by grounding the question in a specific transaction.
Healthcare
Healthcare organizations achieve average response rates of 25-35% for patient satisfaction surveys. Response rates vary by care setting. Outpatient surveys generate higher response rates than inpatient surveys. Pediatric surveys generate lower response rates because parents may not feel authorized to provide feedback on behalf of their children.
Healthcare surveys face additional compliance requirements under HIPAA. Response rates may suffer if patients perceive privacy risks. Clear privacy language in survey invitations can mitigate this concern.
Financial Services
Financial services companies achieve average response rates of 20-30% for customer satisfaction surveys. Response rates vary by product type. Credit card surveys generate higher response rates than mortgage or investment surveys. Response rates also vary by customer segment, with high-net-worth individuals responding at lower rates.
Financial services surveys must balance regulatory compliance with research objectives. Overly cautious survey design that avoids asking relevant questions produces less actionable data.
Education
Educational institutions achieve average response rates of 30-50% for student satisfaction surveys. Response rates vary by survey timing. End-of-semester surveys generate higher response rates than mid-semester surveys. Surveys tied to grade release generate higher response rates than surveys sent independently.
Education surveys benefit from captive audiences and existing communication channels. Response rates improve when surveys are promoted through multiple channels including email, LMS announcements, and in-class reminders.
Common Survey Email Mistakes That Kill Response Rates
Beyond the three failure modes mentioned in competitor content (timing, deliverability, personalization), many additional mistakes reduce response rates. Avoiding these pitfalls often produces larger improvements than optimizing already-functional elements.
Survey Fatigue From Over-Surveying
Sending surveys too frequently creates respondent fatigue. Customers who receive monthly surveys stop responding to all of them. Limit survey requests to 2-4 per year per customer unless they explicitly opt in to more frequent feedback opportunities.
Different survey types count toward the same fatigue limit. A customer who received an NPS survey in January and a product feedback survey in March may ignore a CSAT survey in June regardless of the different topics. Track survey send frequency at the contact level, not the campaign level.
Asking the Wrong Questions
Surveys that ask questions respondents cannot answer produce low response rates and low-quality data. Do not ask prospects about features they have never used. Do not ask new customers about long-term satisfaction. Do not ask users about administrative features they never access.
Review survey questions for answerability before sending. If a question requires speculation or estimation, rephrase it or remove it. Respondents who cannot answer accurately will either abandon or provide random answers that pollute your data.
No Mobile Optimization
Surveys that render poorly on mobile lose 30-50% of potential respondents. Mobile optimization is not optional in 2026. Test every survey and every email template on mobile devices before sending.
Common mobile failures include horizontal scrolling requirements, text too small to read without zooming, tap targets too small to select accurately, and dropdown menus that do not work with touch input. Each of these failures causes abandonment.
Generic or Misleading Subject Lines
Subject lines that promise one thing and deliver another create immediate distrust. “Quick 2-minute survey” that actually takes 10 minutes damages credibility for all future surveys. Be accurate about time commitment and survey purpose.
Subject lines that use clickbait tactics (“You won’t believe what our customers said!”) may increase initial opens but decrease completion rates. Respondents who feel manipulated are less likely to provide thoughtful answers.
Ignoring Partial Completion Data
Partial completions contain valuable information even when incomplete. Analyze where respondents abandon to identify confusing questions, technical issues, or survey length problems. A 40% partial completion rate at question 3 signals a problem with question 3, not with your reminder sequence.
Use partial completion data to improve future surveys rather than simply trying to recover the current partial responses. Fixing the survey design produces compounding improvements across all future campaigns.
No Pre-Survey Communication
Sending a survey without context creates surprise and reduces response rates. Customers who receive an unexpected survey request may question why they are being asked and whether their data will be used appropriately.
Build anticipation for important surveys through pre-survey communication. Announce that a survey is coming, explain why their feedback matters, and set expectations about survey length and timing. Pre-survey communication can increase response rates by 10-15%.
Closing the Loop: Post-Survey Follow-Up That Builds Loyalty
What happens after respondents complete your survey affects their willingness to respond to future surveys. Closing the feedback loop demonstrates that you value their input and act on it. Respondents who see their feedback implemented become advocates who respond to future surveys at higher rates.
Thank You Emails
Send thank you emails within 24 hours of survey completion. The email should acknowledge their specific contribution and reiterate the value of their feedback. Generic “thank you for your response” emails feel automated and reduce the perceived value of participation.
Consider segmenting thank you emails by response type. Detractors may need different follow-up than promoters. Respondents who provided detailed open-ended feedback deserve specific acknowledgment of their thoughtful input.
Sharing Results
Share aggregate survey results with respondents who request them. Transparency about findings demonstrates that you take feedback seriously. Sharing results also creates a sense of community among respondents who see that their peers share similar perspectives.
Do not share individual responses or identifiable data. Aggregate findings into themes and statistics. “65% of respondents rated ease of use as 8 or higher” is appropriate to share. “Customer X from Company Y rated us 3/10” is not.
Acting on Feedback
The most powerful post-survey follow-up is visible action. When respondents see their suggested feature implemented or their reported bug fixed, they become advocates for your feedback program. Public roadmaps that reference customer feedback create a virtuous cycle of participation.
Communicate action taken even when it differs from the feedback received. “We considered your suggestion about X but decided to prioritize Y because…” demonstrates that feedback was reviewed even when not implemented. Respondents prefer honest communication to silence.
Negative Feedback Handling
Negative feedback requires specific response protocols. Detractors who receive no acknowledgment may share their negative experience publicly. Detractors who receive prompt, empathetic responses often become advocates.
Create escalation paths for negative feedback. Support teams should receive alerts when detractors respond to surveys. Account managers should receive alerts when strategic accounts provide negative feedback. Response time targets should be under 24 hours for detractors.
Building Long-Term Survey Relationships
Customers who respond to one survey are more likely to respond to future surveys. Maintain a “survey panel” of engaged respondents who receive more frequent survey opportunities. These panel members provide higher-quality responses and serve as a reliable feedback source.
Reward consistent survey participation with recognition or exclusive opportunities. Early access to beta features, invitations to customer advisory boards, or public acknowledgment of their contribution can increase panel retention.

A/B Testing Framework for Survey Email Campaigns
Systematic testing identifies what works for your specific audience. Generic best practices provide starting points, but only testing reveals what resonates with your respondents.
Variables Worth Testing
Subject Line Variables:
- Personalization vs. no personalization
- Question format vs. statement format
- Specificity vs. generality
- Curiosity vs. directness
Send Time Variables:
- Day of week (Tuesday vs. Wednesday vs. Thursday)
- Time of day (9 AM vs. 11 AM vs. 2 PM)
- Time zone targeting vs. sender time zone
Email Body Variables:
- Length (short vs. medium vs. long)
- CTA placement (beginning vs. middle vs. end)
- Personalization depth (name only vs. company vs. usage context)
- Tone (formal vs. conversational)
Survey Design Variables:
- Length (5 questions vs. 10 questions)
- Question order (easy first vs. important first)
- Incentive type (gift card vs. donation vs. none)
- Progress indicator (with vs. without)
Testing Methodology
Test one variable at a time. Testing multiple variables simultaneously produces results that cannot be attributed to specific changes. Document your hypothesis before testing: “Personalized subject lines will increase open rates by 20% compared to generic subject lines.”
Run tests for sufficient sample sizes. A test with 50 sends per variant cannot produce statistically significant results. Minimum sample sizes depend on expected effect size and baseline conversion rates. Consult statistical resources or testing platforms for sample size calculations.
Documenting and Applying Results
Record winning variants for future campaigns. A subject line that wins in Q1 may not win in Q3 if audience composition or market conditions change. Re-test periodically rather than assuming permanent validity.
Apply learnings across campaigns. A subject line pattern that works for NPS surveys may also work for product feedback surveys. Test cross-campaign applicability rather than starting from scratch for each survey type.
Key Takeaways
- A single survey email caps at 12-15% response rate. A 4-touch reminder sequence with proper timing pushes B2B response rates to 25-35%.
- Survey design matters as much as email delivery. Surveys with 5-7 questions, mobile optimization, and clear progress indicators outperform longer, poorly designed surveys regardless of reminder quality.
- Different survey types require different reminder strategies. NPS surveys need relationship-focused messaging. CSAT surveys need transaction-specific context. Product feedback surveys need usage context.
- Compliance is not optional. CAN-SPAM, GDPR, and CASL each impose requirements for sender identification, unsubscribe mechanisms, and consent that affect survey program design.
- Mobile optimization is critical. Over 60% of survey responses come from mobile devices. Email templates and survey platforms that render poorly on mobile lose 30-50% of potential respondents.
- Incentives boost response rates but introduce bias. Consider whether the research goal requires unbiased responses before implementing incentive programs.
- Post-survey follow-up builds long-term response rates. Thank you emails, result sharing, and visible action on feedback increase willingness to respond to future surveys.
- Test systematically rather than following generic best practices. Only testing reveals what works for your specific audience and use case.
Frequently Asked Questions
How long should my survey be to maximize completion rates?
Surveys with 5-7 questions achieve the best completion rates across industries. Response rates drop 15-20% when surveys exceed 10 questions. Mobile respondents abandon at even shorter lengths. Tell respondents upfront how long the survey takes, and ensure your estimate is accurate or slightly conservative. A survey that promises 3 minutes but delivers 5 minutes creates frustration that reduces future response rates.
What’s the best incentive for a B2B survey?
B2B audiences respond well to charitable donation incentives and early access to new features. Gift cards of $5-10 can increase response rates by 10-20%, but consider whether the incentive aligns with your research goals. NPS surveys measuring genuine loyalty may see artificially inflated scores when incentives are offered. Document your incentive program for compliance purposes, as some jurisdictions treat incentives as taxable income.
How do I handle negative feedback from survey respondents?
Create escalation paths that route detractor responses to appropriate teams within 24 hours. Support teams should receive alerts for negative support experience feedback. Account managers should receive alerts when strategic accounts provide negative feedback. Respond to detractors with empathy and specific next steps rather than generic acknowledgments. Detractors who receive prompt, thoughtful responses often become advocates who respond to future surveys at higher rates.
Should I send surveys via email, SMS, or in-app notifications?
Email remains the most versatile channel for survey distribution, but multi-channel approaches can increase response rates by 15-25%. SMS achieves 98% open rates within 3 minutes but should be used sparingly to avoid fatigue. Push notifications work well for app users but require app installation. Consider a tiered approach: email for the initial invitation, SMS for the first reminder, and push notification for the final reminder if the recipient has your app installed.
How do I comply with GDPR when sending survey emails?
Document your lawful basis for processing personal data before sending. For existing customers, legitimate interest typically applies. For prospects, obtain and document consent through an opt-in process. Collect only the personal data necessary for your research purpose. Provide a privacy policy link in survey emails that explains data collection, usage, retention, and deletion request procedures. Survey responses are personal data under GDPR and subject to access and deletion requests.
What response rate should I expect for my industry?
SaaS companies achieve 30-40% response rates for NPS surveys with proper reminder sequences. B2B services companies average 20-30%. E-commerce companies average 15-25% for post-purchase surveys. Healthcare organizations average 25-35% for patient satisfaction surveys. Financial services companies average 20-30%. Education institutions average 30-50% for student surveys. Use these benchmarks to set realistic expectations and identify improvement opportunities rather than as targets to chase.
How many questions is too many for a customer satisfaction survey?
Customer satisfaction surveys should stay under 7 questions for optimal completion rates. The first 2-3 questions should capture overall satisfaction and likelihood to recommend. Additional questions should focus on specific interaction attributes that explain the overall rating. Save open-ended questions for the end when respondents are invested. If you need more than 7 questions, consider breaking the survey into multiple shorter surveys sent at different times.
Can I send survey reminders to people who already responded?
No. Maintain suppression lists that exclude respondents who have already completed the survey. Sending reminders to completed respondents wastes their time and reduces trust in your survey program. Most survey platforms provide automatic suppression functionality. If your platform does not, export completed respondent email addresses and add them to your suppression list before sending reminders. Deduplication should happen at the campaign level, not the sequence level.
How do I know if my survey emails are landing in spam folders?
Test inbox placement before sending survey campaigns to your full list. Send test emails to seed accounts at Gmail, Outlook, Yahoo, and corporate domains. Check whether test emails land in primary inbox, promotions, spam, or get blocked entirely. Tools like GlockApps, Mail-Tester, and MXToolbox provide inbox placement testing. Run placement tests after any significant change to your email infrastructure or sending patterns. Deliverability issues should be resolved before launching campaigns rather than diagnosed after low response rates.
What’s the difference between NPS, CSAT, and CES surveys?
NPS (Net Promoter Score) measures loyalty by asking “How likely are you to recommend us?” on a 0-10 scale. Responses are categorized as promoters (9-10), passives (7-8), and detractors (0-6). NPS works well for relationship health tracking. CSAT (Customer Satisfaction) measures transaction satisfaction by asking “How satisfied were you with [specific interaction]?” CSAT works well for support and post-purchase feedback. CES (Customer Effort Score) measures ease of interaction by asking “How easy was it to [complete task]?” CES works well for identifying friction in customer journeys. Choose the metric that aligns with your research objective rather than defaulting to NPS for all surveys.